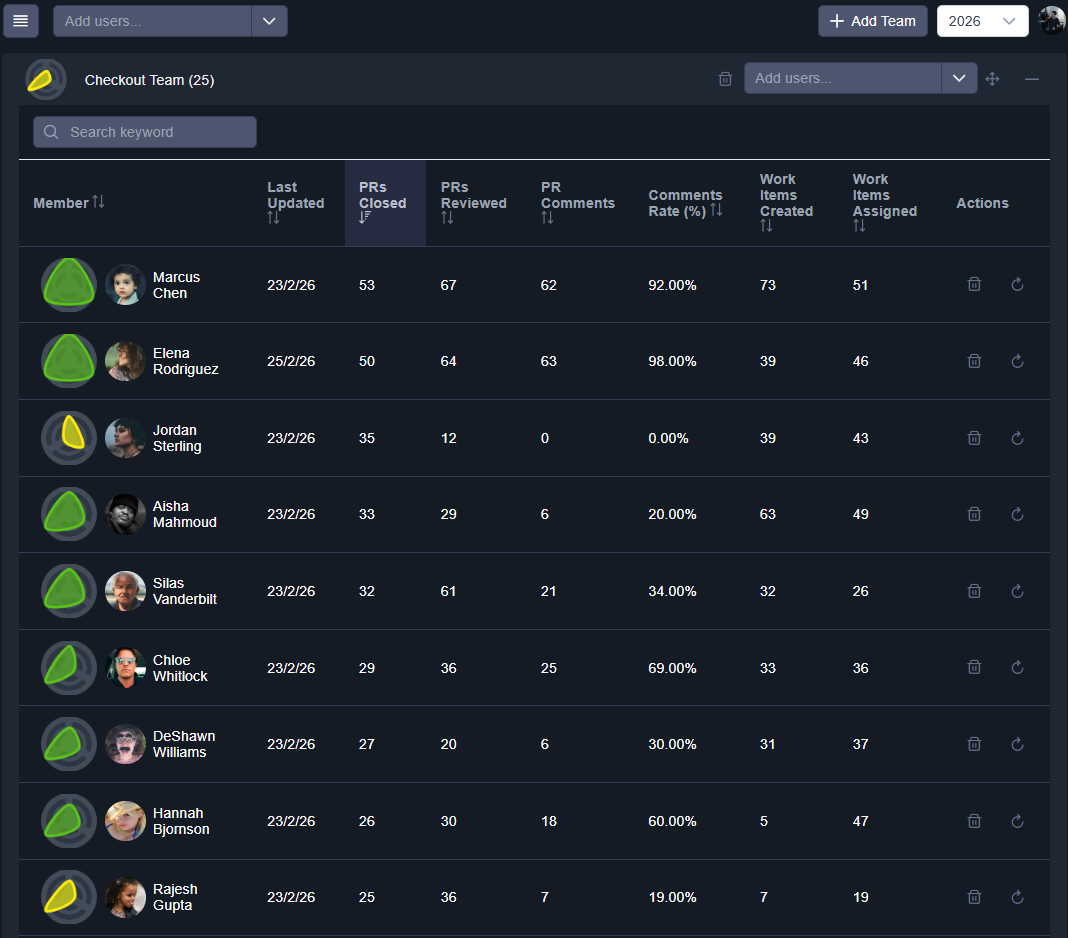
Objective workload distribution
Spot overload fast and rebalance with confidence.
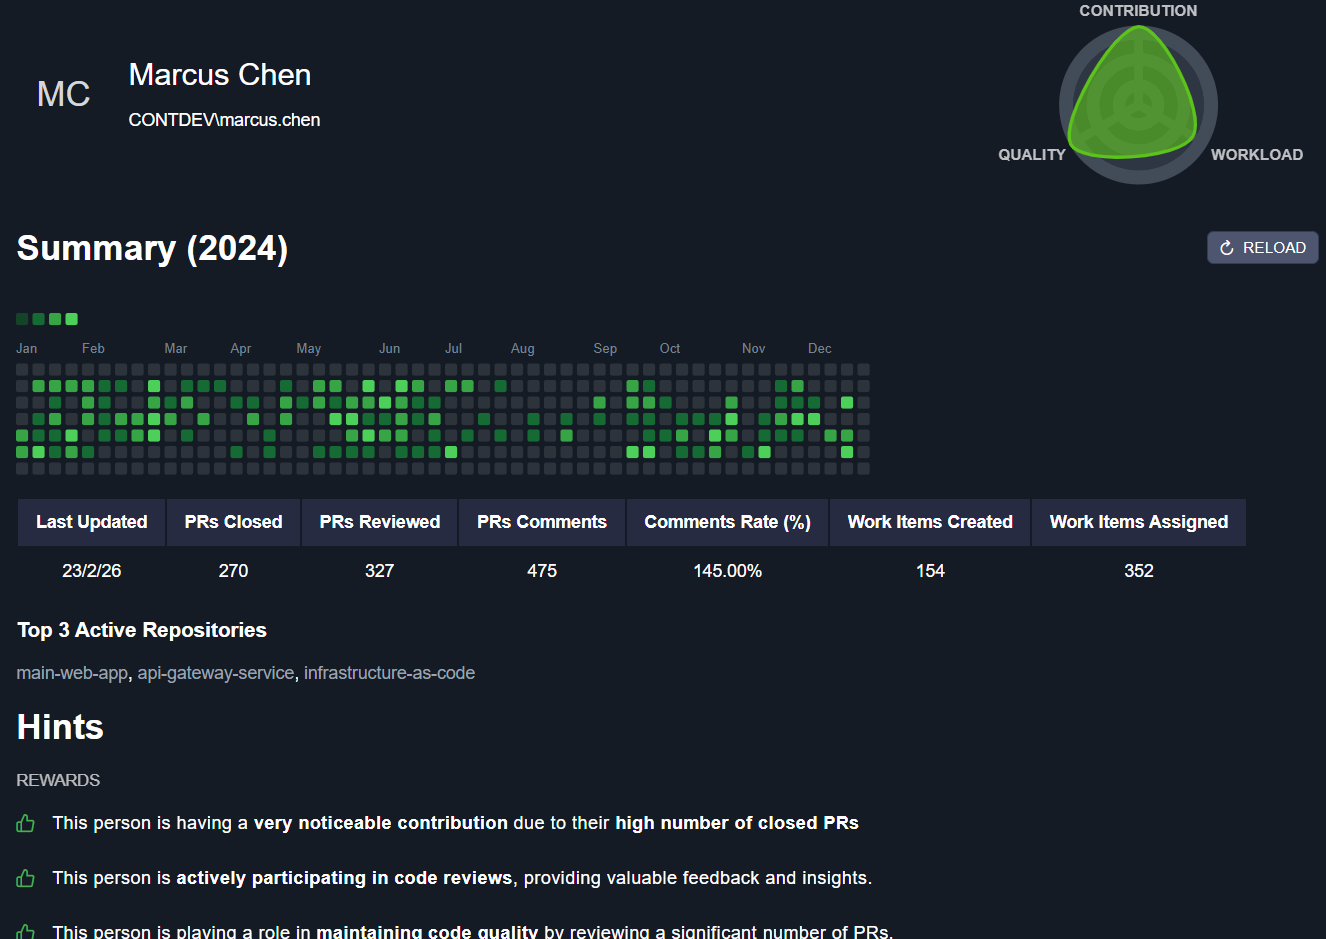
Connect once. See contribution trends by team and developer
For Software Managers, VPs, and CTOs who manage capacity and delivery.
Spot overload fast and rebalance with confidence.
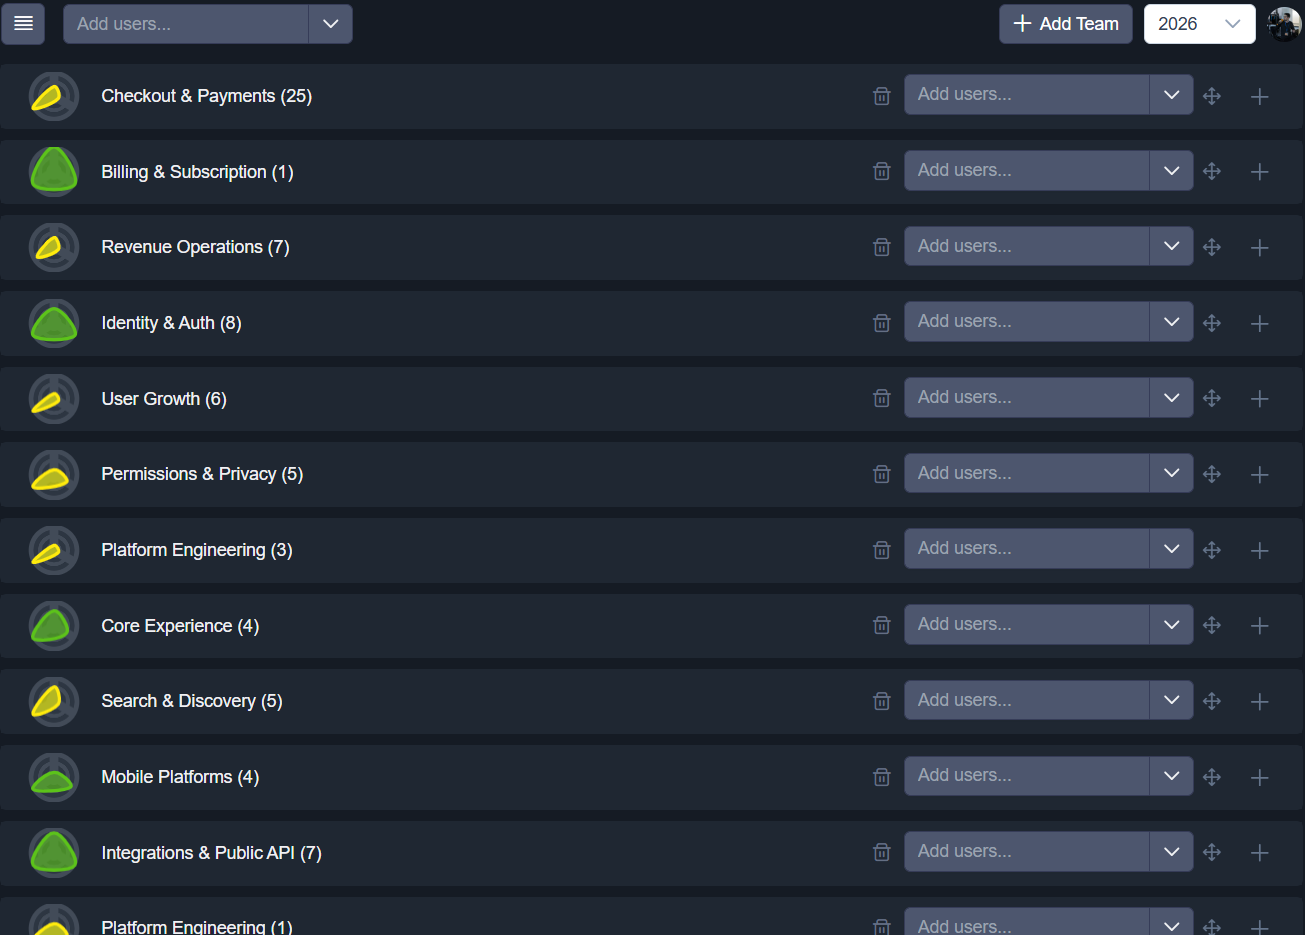
Compare teams in one view and catch bottlenecks early.
Share one live view with CTOs, VPs, and managers.
Drill into team trends and compare contribution patterns using leadership-ready views.
Quick answers about why the product is free and how your Azure data is handled.
ContributionsDev is free right now because it started from a real operational need and the lack of strong alternatives. The goal is to share the solution with the community so other teams can solve the same problem. The business model is to grow in a structured way first, and later evaluate monetization only if there is real infrastructure cost or meaningful competitive pressure. At that stage, options could include selling the project or charging a symbolic fee to keep servers running.
No. You do not need to add a credit card, and you do not need to pay anything. ContributionsDev is currently 100% free to use.
No. Azure access token information is not stored in our database. It is only kept on your own computer in local storage and remains protected in your browser environment.
Contributions Graph Azure DevOps is currently available as a single free plan.
€0/month
Ideal for any company using Azure DevOps.
Start FreeLooking for "Contributions Graph Azure DevOps"? This is the modern upgrade.